Introduction
***Social media has evolved into a powerhouse for businesses across the globe.*** In today’s digital landscape, platforms like Facebook, Instagram, LinkedIn, and WhatsApp are no longer just social spaces; they are vital tools for **driving engagement**, **building trust**, and **expanding customer reach**. With billions of active users, these platforms present businesses with **unmatched opportunities** to promote products, share updates, and connect with audiences in real-time.
In this article, we’ll delve into compelling statistics that illustrate how social media is reshaping the way businesses operate, offering a competitive edge in a rapidly changing market.
Editor’s Choice
- The Cropink report sheds light on the fact that **96%** of small businesses leverage social media for marketing.
- Approximately **83%** of companies highlight increased brand visibility as the main benefit of social media use.
- Between 2019 and 2024, social media ad spending in the U.S. surged by a staggering **140%**.
- Conversely, around **74%** of users find social media ads to be annoying.
- As of February 2025, **63.9%** of the global population are active on social media, spending an average of **2 hours and 21 minutes** daily on these platforms.
- According to WordStream, more than **70%** of satisfied customers on social media recommend the businesses they engage with to friends.
- On average, users click **12 Facebook ads** monthly, while **81%** use Instagram to discover products, and **80%** of Twitter users express a more positive sentiment towards businesses.
- Four out of five LinkedIn users wield significant influence over purchasing decisions, while **TikTok** manages to keep **46%** of its audience fully engaged.
Leading Social Media Platforms For Businesses
(Reference: strapiapp.com)
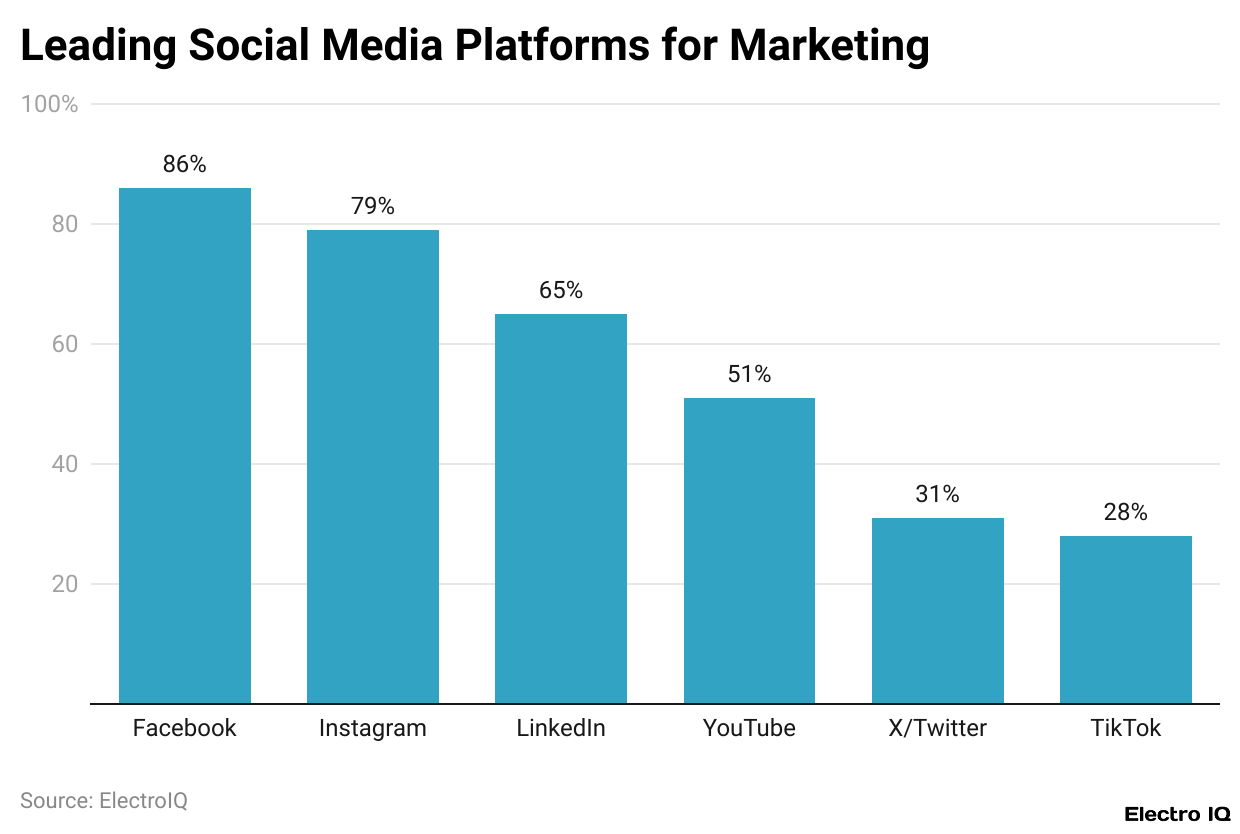
- Data indicates that a whopping **86%** of marketers utilized Facebook for business marketing in 2024.
- Following closely is Instagram at **79%**, and LinkedIn at **65%**.
- Other notable platforms include YouTube (**51%**), X/Twitter (**31%**), and TikTok (**28%**).
Social Media For Business Statistics By Age And Gender Demographics
| Social Platform | 16 to 24 years | 25 to 34 years | 35 to 44 years | 45 to 54 years | 55 to 64 years | |||||
|---|---|---|---|---|---|---|---|---|---|---|
| Male | Female | Male | Female | Male | Female | Male | Female | Male | Female | |
| 26.6% | 24.8% | 18.4% | 20.8% | 11.7% | 16% | 9.4% | 13.9% | 6.1% | 10.2% | |
| 14.1% | 12.7% | 14.7% | 14.3% | 17.3% | 15.4% | 19.5% | 17.3% | 21.9% | 21.1% | |
| 7.8% | 5.9% | 13.5% | 10.6% | 14.7% | 13.2% | 16.4% | 14.9% | 17.5% | 17.1% | |
| 8.2% | 8.2% | 11.8% | 11.7% | 16% | 15.5% | 14.4% | 13.6% | 14.4% | 12.0% | |
| TikTok | 9.6% | 15.5% | 7.1% | 11.3% | 5.7% | 7.8% | 5.3% | 6.9% | 4.3% | 5% |
| Douyin | 6.5% | 6.6% | 8.5% | 8.1% | 8.2% | 9.8% | 6.8% | 6.4% | 6.6% | 5.4% |
| X | 4.2% | 3.1% | 4.6% | 2.1% | 4% | 1.8% | 3.8% | 1.6% | 3.3% | 1.7% |
By Ad Audience Users
(Source: smartinsights.com)
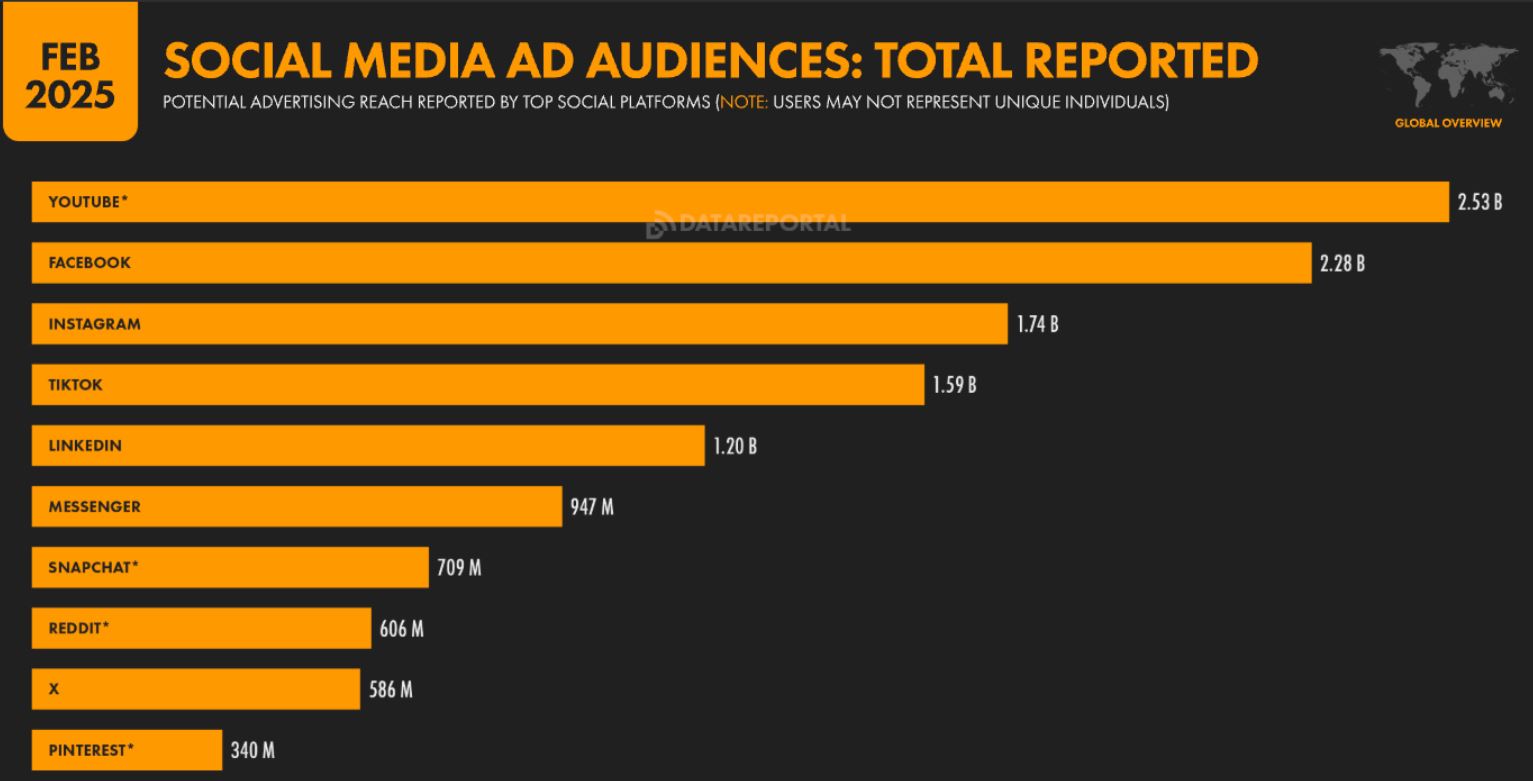
- As of February 2025, **YouTube** boasts the largest social media ad audience with **2.35 billion users**, closely followed by **Facebook** at **2.28 billion**.
- Other platforms like Instagram (**1.74 billion**), TikTok (**1.59 billion**), and LinkedIn (**1.20 billion**) also have sizable ad audiences.
Social Media Advertising Statistics For Business
- The Cropink report of 2024 reveals that global social media advertising spending surpassed **USD 234.14 billion**, marking a **140%** increase in just five years.
- By the end of 2029, social media ad spending is anticipated to hit around **USD 345 billion**.
- Notably, **48%** of social media users have made purchases after encountering an advertisement, with millennials at **53%** and women at **56%**.
- Interestingly, about **78%** of adults over 35 perceive that there are too many ads on these platforms, while **74%** express annoyance at repetitive ads.
- For **56%** of users, advertising diversity is crucial, while **44%** feel that the ads fail to align with their interests.
- Among top-performing ad campaigns, **31%** employed emotional content, as opposed to just **16%** that leaned on logical or factual messaging.
Total Time Spent By Users On Social Media Applications
| Platforms | Average Time per User |
| TikTok | 34h 56m |
| YouTube | 27h 10m |
| 17h 17m | |
| 16h 13m | |
| 16h 13m | |
| Line | 6h 57m |
| Telegram | 4h 12m |
| Messenger | 3h 33m |
| Snapchat | 3h 20m |
| Discord | 3h 06m |
| 2h 59m | |
| 1h 31m | |
| 48m | |
| Threads | 39m |
Facebook Engagement Rate Statistics
(Source: smartinsights.com)
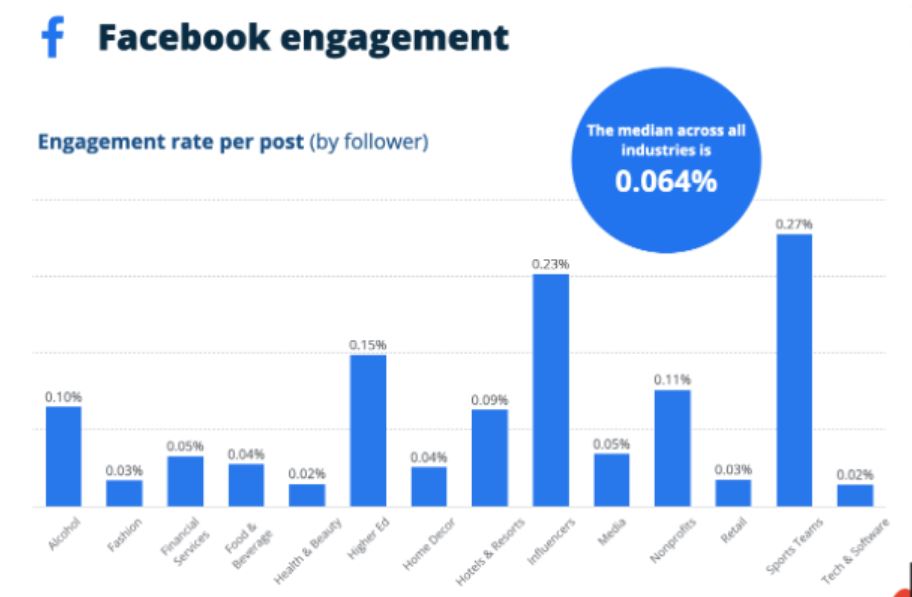
- Facebook maintains a median engagement rate of **0.064%** per post across industries.
- The **top performers** are sports teams (**0.27%**), influencers (**0.23%**), and higher education institutions (**0.15%**).
- In contrast, lower engagement rates are seen in tech and software (**0.02%**) and financial services (**0.03%**).
- Media sectors perform slightly better at **0.11%**, while nonprofits linger at **0.05%**.
Instagram Engagement Rate Statistics
(Source: smartinsights.com)
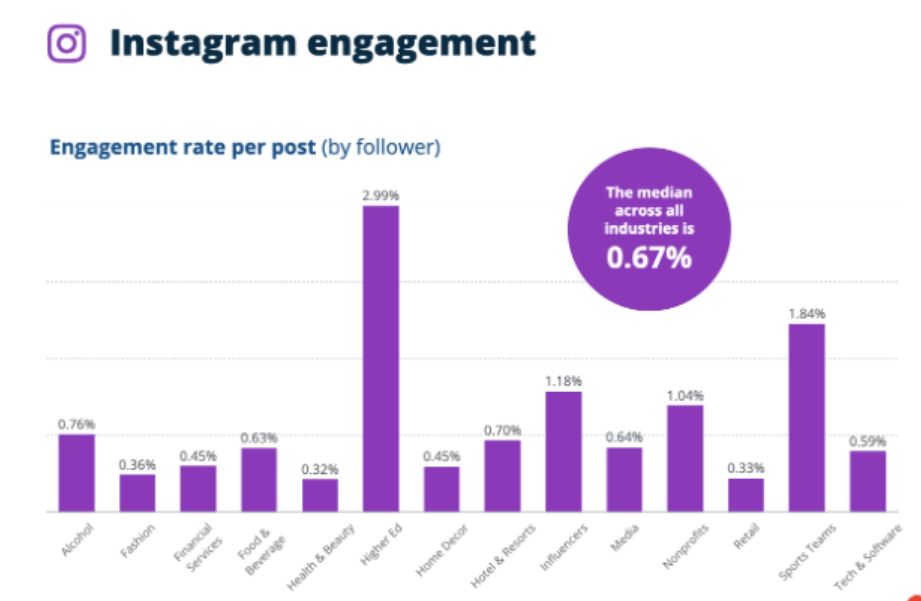
- Instagram’s median engagement rate stands at **0.067%** across all industries.
- The highest rates are among higher education (**2.99%**), sports teams (**1.84%**), and influencers (**1.18%**).
- Conversely, the lowest engagement rates are within the health and beauty (**0.32%**) and fashion sectors (**0.36%**).
Most Popular Social Media Platforms Statistics By Generation
(Source: cloudfront.net)
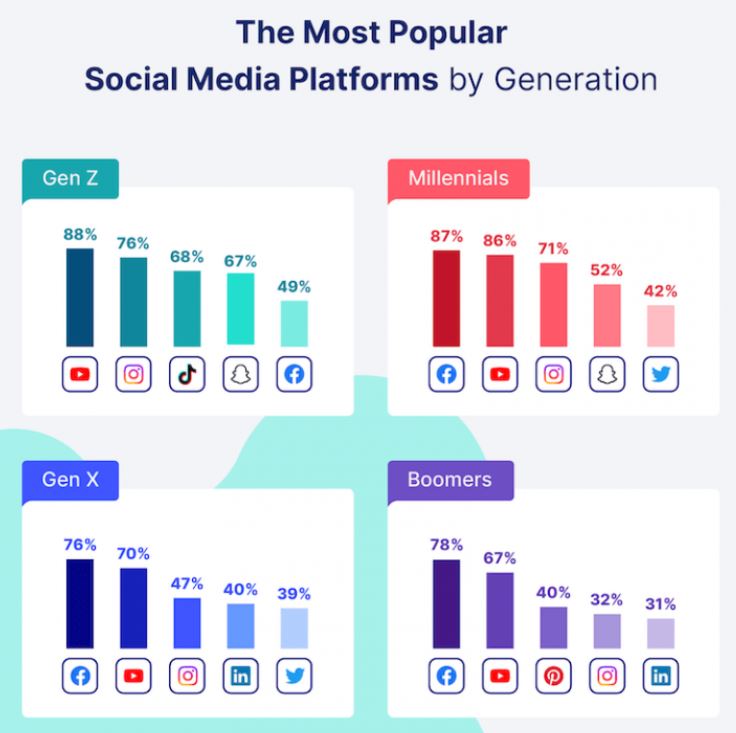
- As of 2025, **88%** of Gen Z utilizes YouTube for business marketing.
- Facebook attracts **87%** of millennials, **76%** of Gen X, and **78%** of Boomers.
Additional generational statistics for various platforms are as follows:
| Platforms | Gen Z | Millennials | Gen X | Boomers |
|---|---|---|---|---|
| YouTube | 88% | 86% | 70% | 67% |
| 49% | 87% | 76% | 78% | |
| 76% | 71% | 47% | 32% | |
| TikTok | 68% | – | – | – |
| Snapchat | 67% | 52% | – | – |
| 49% | 42% | 39% | – | |
| – | – | 40% | 32% |
Business Marketing Statistics By Facebook
- Slick Text’s 2025 report reveals that Facebook boasts over **3 million active users**.
- In the United States, more than **80%** of the population has Facebook accounts.
- One in three adults claims to receive news through Facebook.
- On average, users spend around **19.6 hours** on Facebook each month, with individual visits lasting approximately **30 minutes**.
- Facebook commands about **25%** of all advertising spending, trailing Google at **28%** and ahead of Amazon at **10%**.
- Live videos on Facebook generate an impressive **26% engagement rate**.
- 66% of users explore local business pages weekly.
- Users typically interact with around **eight ads** monthly on the platform.
- Facebook’s ads boost conversion rates by nearly **2.85 times**.
- Regular posts have an engagement rate just below **4%**, while organic reach stands slightly above **5%**.
- Importantly, more than **98%** of Facebook users access it via mobile devices, cementing its status as a mobile-first platform.
By YouTube
- Reports from Status Brew indicate that YouTube ranks as the second-largest social media platform with over **2.5 billion users**, of which **476 million** are from India as of July 2024.
- YouTube Premium and YouTube Music collectively accumulate over **100 million paid subscribers**.
- Users spend an average of **19 minutes daily** watching videos.
- Globally, **1 billion hours** of YouTube content is consumed on televisions each day.
- A staggering **500 hours** of new video content is uploaded every minute.
- nearly **46%** of internet users engage with YouTube at least monthly, reaching about **31%** of the world’s population.
- Gender demographics reveal **54.3%** male users versus **45.7%** female, with visitors averaging around **49 minutes** per session.
By WhatsApp
- Status Brew Insights notes that WhatsApp has a **global monthly user base** of **2.30 billion**.
- It’s the second most favored platform among businesses, with **24.7%** utilization (approximately **1 in 4** individuals).
- Monthly downloads for WhatsApp Messenger surpass **45 million**, while WhatsApp Business records **23.67 million** downloads.
- In Q2 2024, the United States led with **5.18 million** iPhone downloads of WhatsApp.
- **24.7%** of the global population uses WhatsApp, sending nearly **1 billion messages** daily.
- On average, users open the app around **929.9 times** each month.
By LinkedIn
- LinkedIn captures around **875 million users** globally.
- In the U.S., approximately **one in three** adults using LinkedIn earns over **USD 75,000** annually.
- The primary age group on this platform is **25 to 34 years**, comprising **60%** of users.
- About **92%** of Fortune 500 companies actively engage on LinkedIn.
- For **B2B marketers**, **97%** utilize LinkedIn, and **82%** rate it as their most effective tool.
- Complete profiles receive **30% more views**, while including links in posts enhances engagement by **45%**.
- Regular posts containing **eight images** tend to perform best, while consistent posting (at least once a week) helps maintain visibility.
- Most marketers post **4 to 6 times** weekly.
By Instagram
- Instagram ranks with around **2 billion active users** as the **4th most utilized platform** for business.
- Average daily usage in the U.S. is about **30 minutes**.
- Nearly **1 billion users** interact with Instagram’s advertising features, representing **one-third** of all internet users.
- Most brands share **17 stories** monthly on the platform.
- Meta identifies Instagram as the leading platform for user-brand interactions.
- Business accounts see follower growth at a modest **1%** per month.
- Overall engagement rates for brands on the platform hover at **0.54%**.
- Approximately **one in three** users make purchases through Instagram, with **15%** of American consumers initiating their shopping journey there.
- Nearly **98%** of marketers prefer Instagram for influencer campaigns, outpacing Facebook by **50%**.
- Reels significantly contribute to maintaining engagement, with **91%** of users watching videos weekly.
By TikTok
- As of 2024, users spend around **95 minutes daily** on TikTok, with **one in three** logging in each day.
- About **50%** of TikTok users fall within the **18 to 34 age range**.
- TikTok secured the title of the most downloaded app globally in 2022, with an engagement rate of **6%**—though this is reportedly dipping by **28%** annually.
- Currently, only **18%** of marketers leverage TikTok, yet **55%** of users have made purchases post-ad exposure.
- TikTok ads reach roughly **19%** of global internet users.
- Ads delivering their message within the **first 3 seconds** witness the best performance.
- By 2025, influencers on TikTok had an impressive engagement rate of **15%**, with U.S. rates rising to **18%**.
By Twitter
- Twitter boasts approximately **400 million users** as of 2025.
- A mere **10%** of users generate **90%** of tweets in the U.S.
- The platform attracts a youthful user base, where **77%** of users prefer brands that take a stance on social issues.
- Roughly **50%** of Twitter users seek news and entertainment, with **33%** following brands and businesses.
- Twitter ads receive a **26%** higher view rate than others.
- Daily engagement reveals that **52%** of users visit Twitter daily, while **84%** check it weekly, and **96%** do so at least once monthly.
- On average, U.S. adults spend about **6 minutes** on Twitter each day, with **male users** accounting for **70%** of the platform’s audience.
- An impressive **80%** of B2B marketers utilize Twitter, which boasts a **40%** better ROI compared to other platforms.
By Snapchat
- According to statusbrew.com, Snapchat has amassed over **850 million** monthly active users, with **432 million** logging in daily.
- In Q3 2024, daily users reached **4.43 million**, representing a **9% year-over-year increase**.
- During this period, users shared over **1 billion snaps** publicly each month.
- The platform boasts **more than 12 million subscribers** at present.
- Notably, **89%** of Snapchat users also engage with Instagram.
- As of 2025, average time spent on Snapchat has surged by **25%** from the previous year.
- During the **2024 Paris Games**, over **225 million Snapchatters** interacted with Olympic-related AR experiences.
Benefits of Social Media For Businesses
(Reference: statista.com)
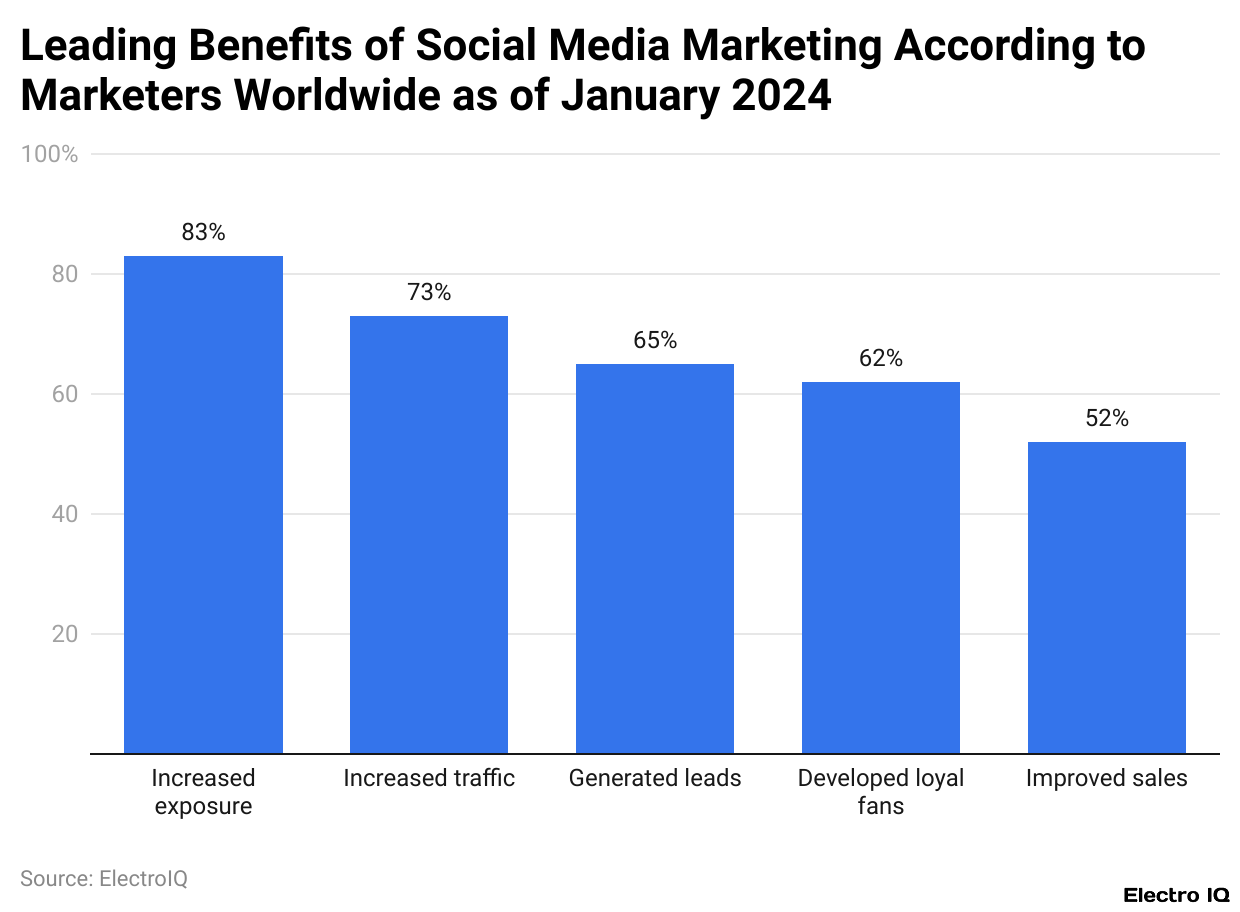
- The 2024 Statista report revealed that **83%** of marketers believe social media marketing enhances exposure.
- Approximately **73%** attribute increased traffic to social media efforts, while **65%** state it generates new leads.
- Additional benefits include the development of loyal customers (**62%**) and improved sales (**52%**).
Reasons For Using Social Media For Businesses
| Profile Optimization | Keep profiles accurate, complete, active, with links to the website and CTAs. |
| Posting | Share useful, entertaining, relevant posts, photos, videos, and stories. |
| Engaging | Encourage likes, shares, comments, and foster follows with customers and influencers. |
| Advertising | Implement paid strategies for reaching targeted audiences. |
| Measuring | Utilize platform analytics to evaluate effectiveness. |
Conclusion
In conclusion, social media has become ***unavoidable for businesses of all sizes***. Platforms like Facebook, Instagram, WhatsApp, LinkedIn, and Twitter provide **direct pathways** to connect with customers, build brand recognition, drive sales, and maintain visibility in a crowded digital landscape. The insights gathered from various reports offer invaluable guidance in understanding the market dynamics and optimizing the potential of social media in business growth.
