Staying informed about the latest Google Ads benchmarks is essential for marketers. It equips you to tackle common client and executive queries, like:
- **“Is this a good CTR?”**
- **“Why is our CPA so high?”**
- **“What’s a good conversion rate, anyway?”**
Conversations around these questions arise frequently, particularly when budgets tighten or performance dips. Yet, without fresh benchmark data, these discussions can devolve into guesswork, vague reassurances, or reliance on outdated reports that no longer reflect today’s competitive advertising landscape.
In 2025, Wordstream by LocaliQ updated its Search Advertising benchmarks, leveraging real data from thousands of Google and Microsoft Ads campaigns across **20 different industries**. These insights will not only help you respond to your stakeholders but also provide a clearer picture of where you stand against the competition.
Key Benchmarks in Google & Microsoft Ads
In this report, you’ll find vital benchmarks for Search campaigns in Google and Microsoft Ads focusing on:
- **Click-through rate (CTR)**
- **Average cost-per-click (CPC)**
- **Conversion rate (CVR)**
- **Cost per lead (CPL)**
Let’s dive deeper into this invaluable data!
Average Click-Through Rate (CTR) by Industry
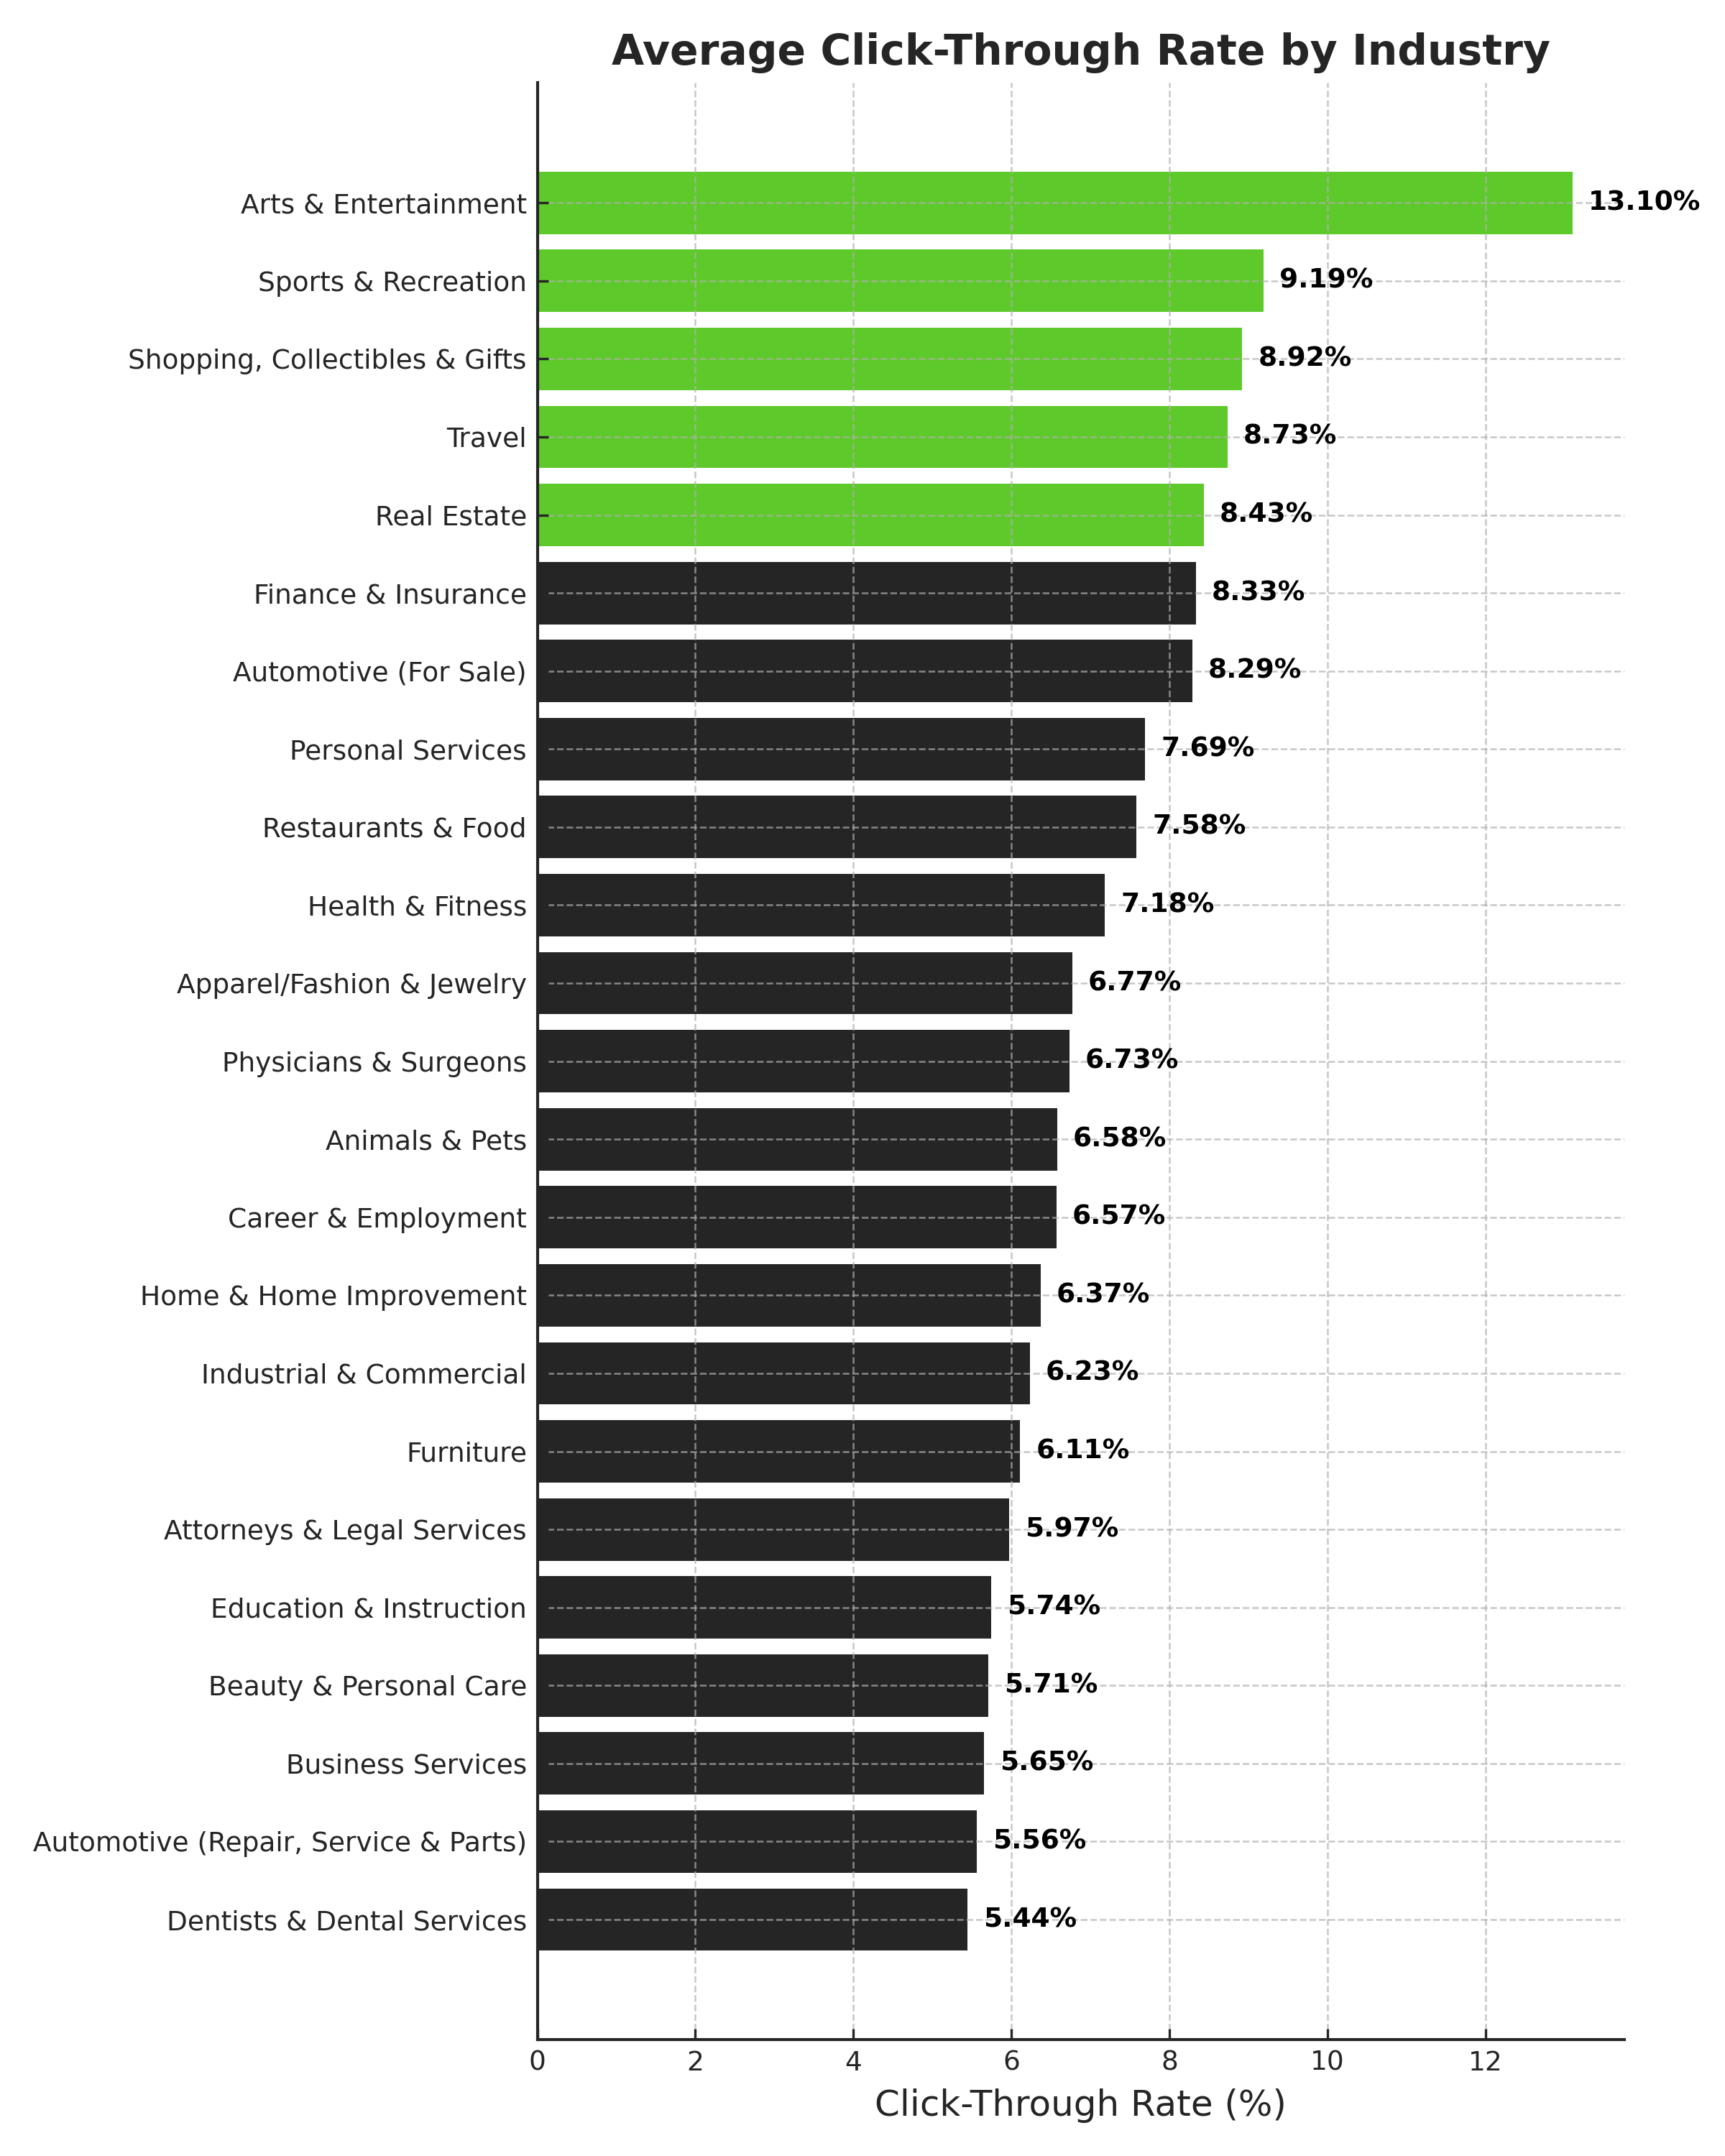
Data from LocaliQ benchmark report, June 2025
The average click-through rate for Google and Microsoft Ads across all industries reached **6.66%** over the last 12 months.
This represents a significant leap from the **1.35%** average CTR reported in 2015. Surprisingly, the **Arts & Entertainment** sector topped the charts with an incredible **13.10%** CTR. Conversely, **Dentists and Dental Services** reported a lower CTR of only **5.44%**.
While CTR is a critical performance indicator, it shouldn’t be viewed in isolation. Factors such as:
- Your competition (Is the SERP saturated?)
- Your bidding strategy
- Your position on the results page
- Your ad copy relevancy
- Your audience targeting
Contribute to these scores. A high CTR might simply indicate that your ad is enticing enough to generate clicks, not that those clicks lead to conversions.
Using tools like Google’s Quality Score can help determine areas needing improvement, such as ad relevance and expected CTR.
Average Cost-Per-Click (CPC) by Industry
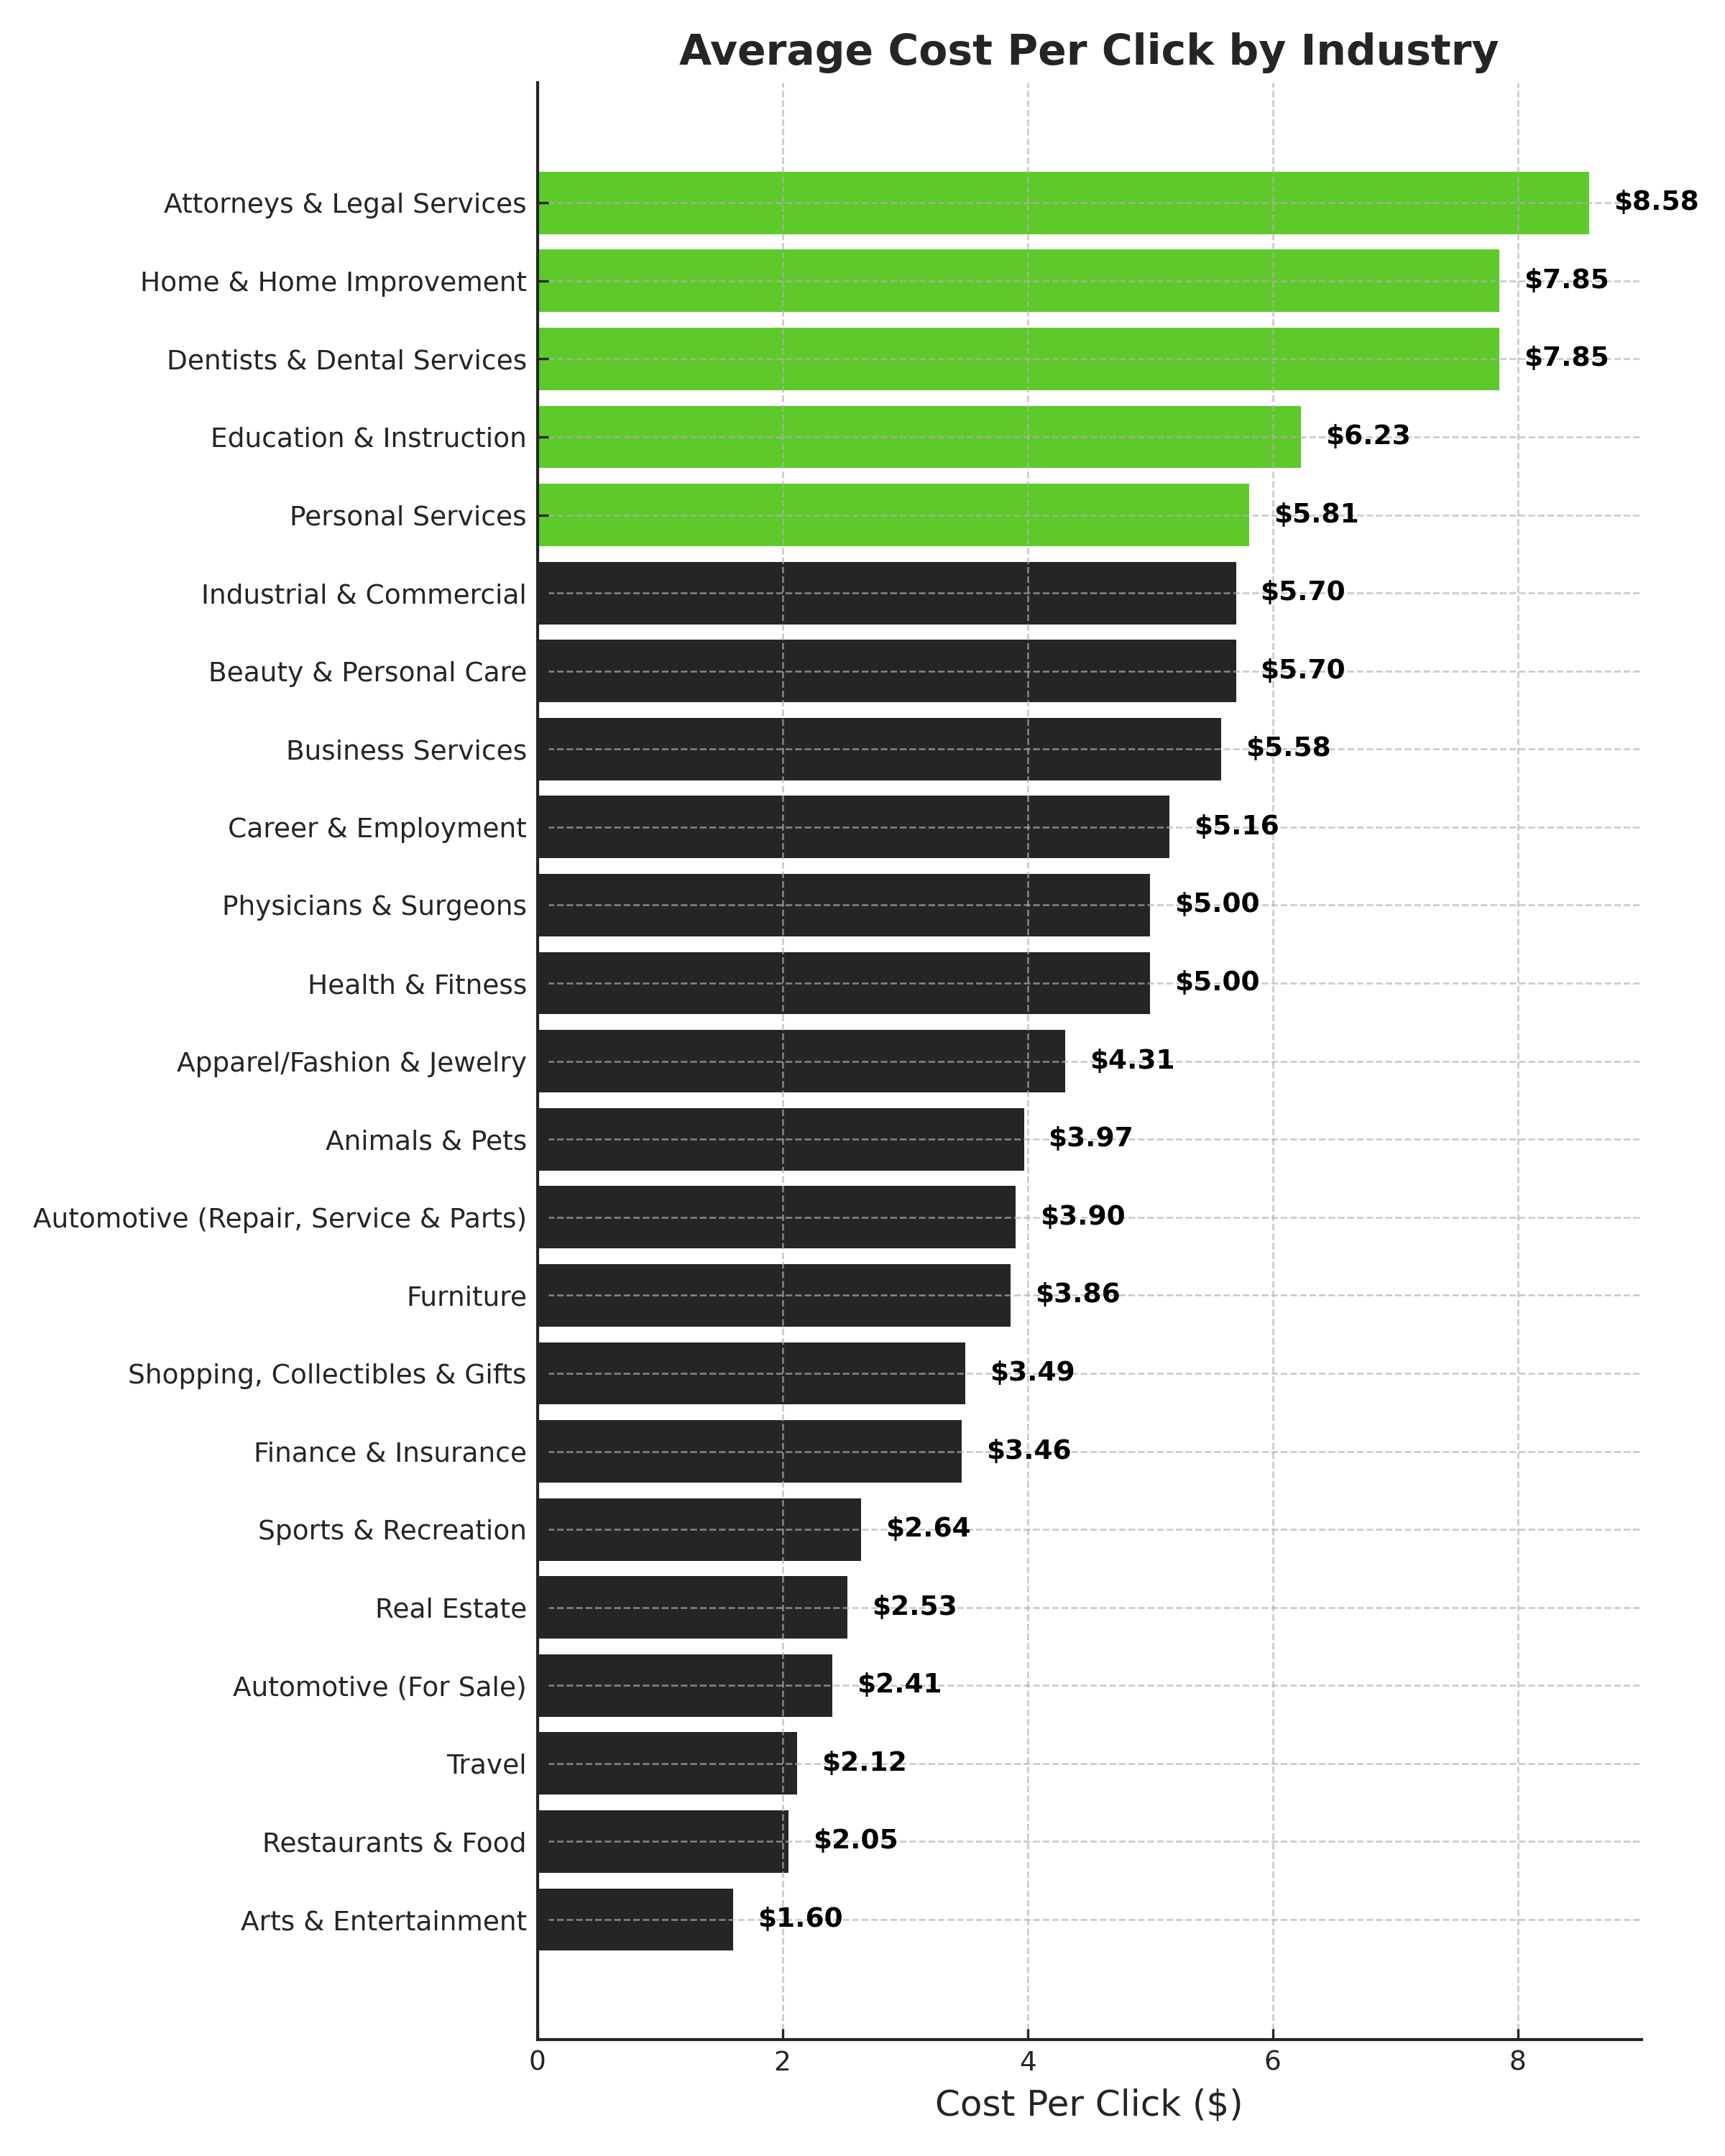
Data from LocaliQ benchmark report, June 2025
The average cost-per-click for Google and Microsoft Ads was **$5.26** last year.
The **Attorneys and Legal Services** industry had the highest CPC at **$8.58**, reflecting the substantial costs involved in customer acquisition. In contrast, **Arts & Entertainment** reported a much lower CPC of **$1.60**.
Analyzing your average CPC is crucial; a high CPC while maintaining low CTR indicates the need to increase bids. Meanwhile, if you enjoy a lower CPC, it’s vital to ensure that your returns justify this spend.
Average Conversion Rates (CVR) by Industry
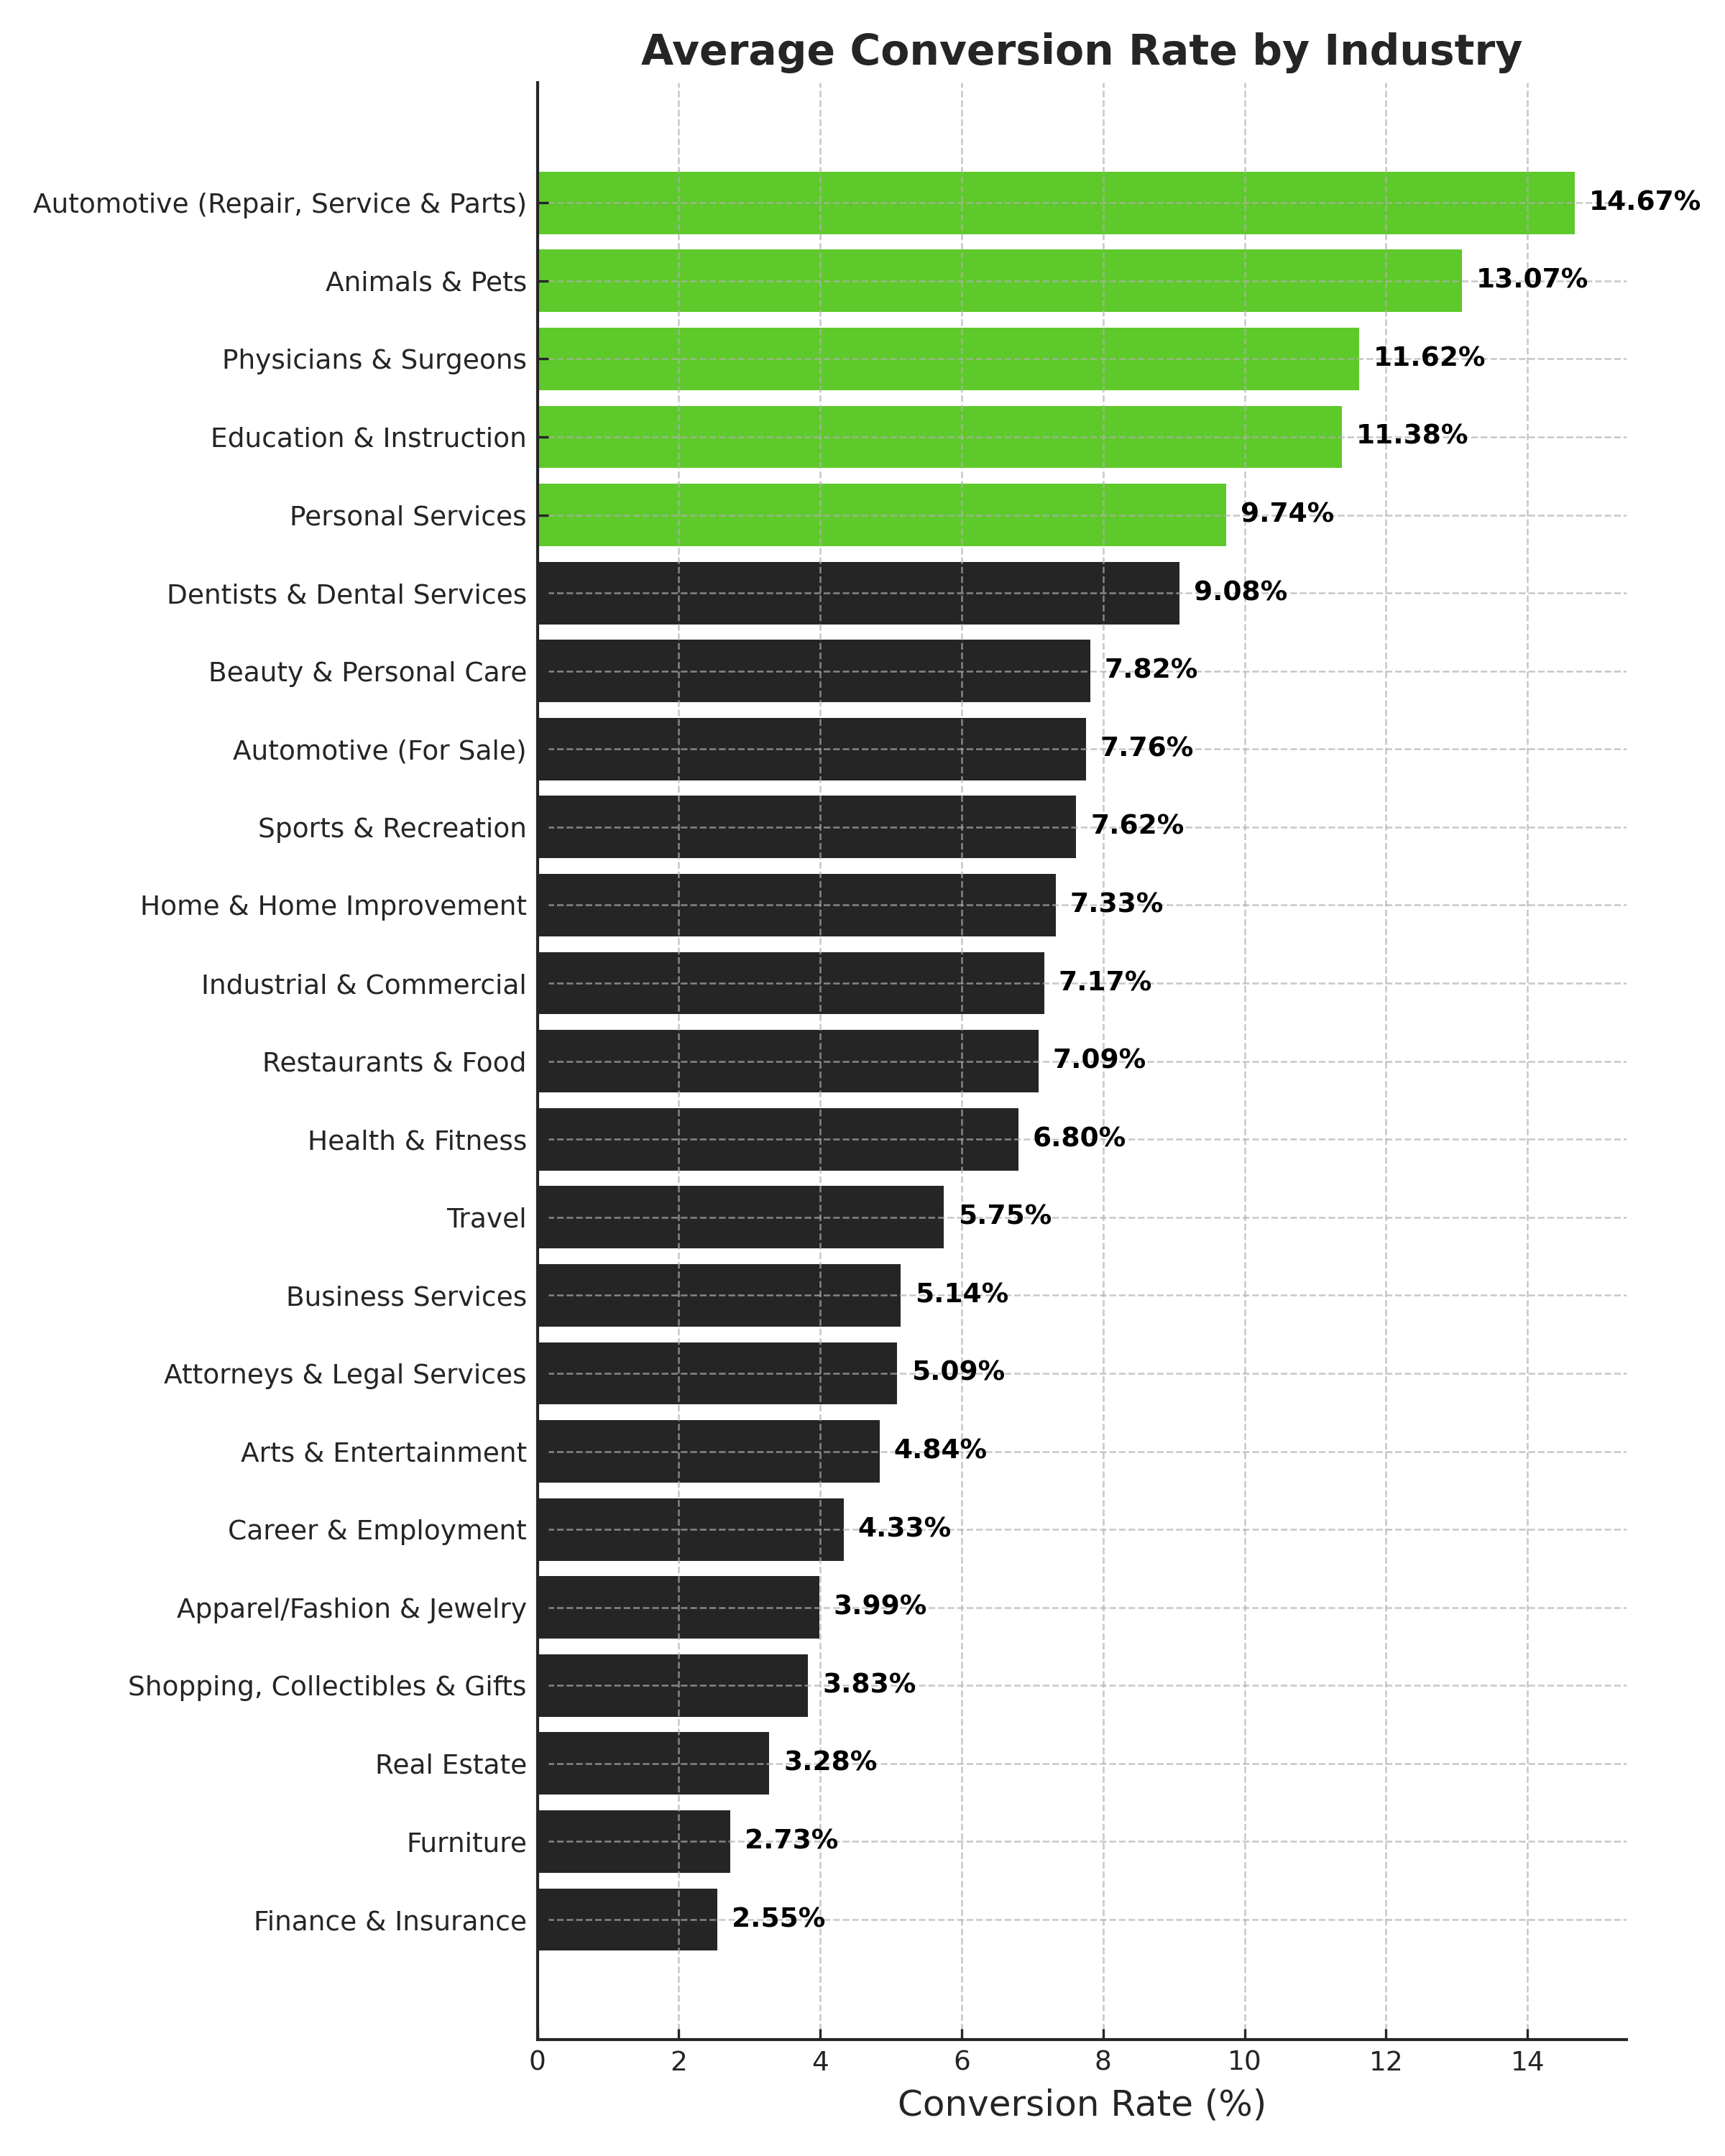
Data from LocaliQ benchmark report, June 2025
The overall average conversion rate across all industries stood at **7.52%** in the last year.
This figure varies significantly by industry. For instance, the **Automotive** sector achieved the highest conversion rate of **14.67%**, while industries like **Finance & Insurance** reported lower rates, as low as **2.55%**.
Understanding why certain industries report lower conversion rates is critical. For example, high-ticket items like furniture usually see more extensive research before purchase, negatively impacting online conversions. Establishing accurate tracking methods for offline conversions is essential.
Average Cost Per Lead (CPL) by Industry
Data from LocaliQ benchmark report, June 2025
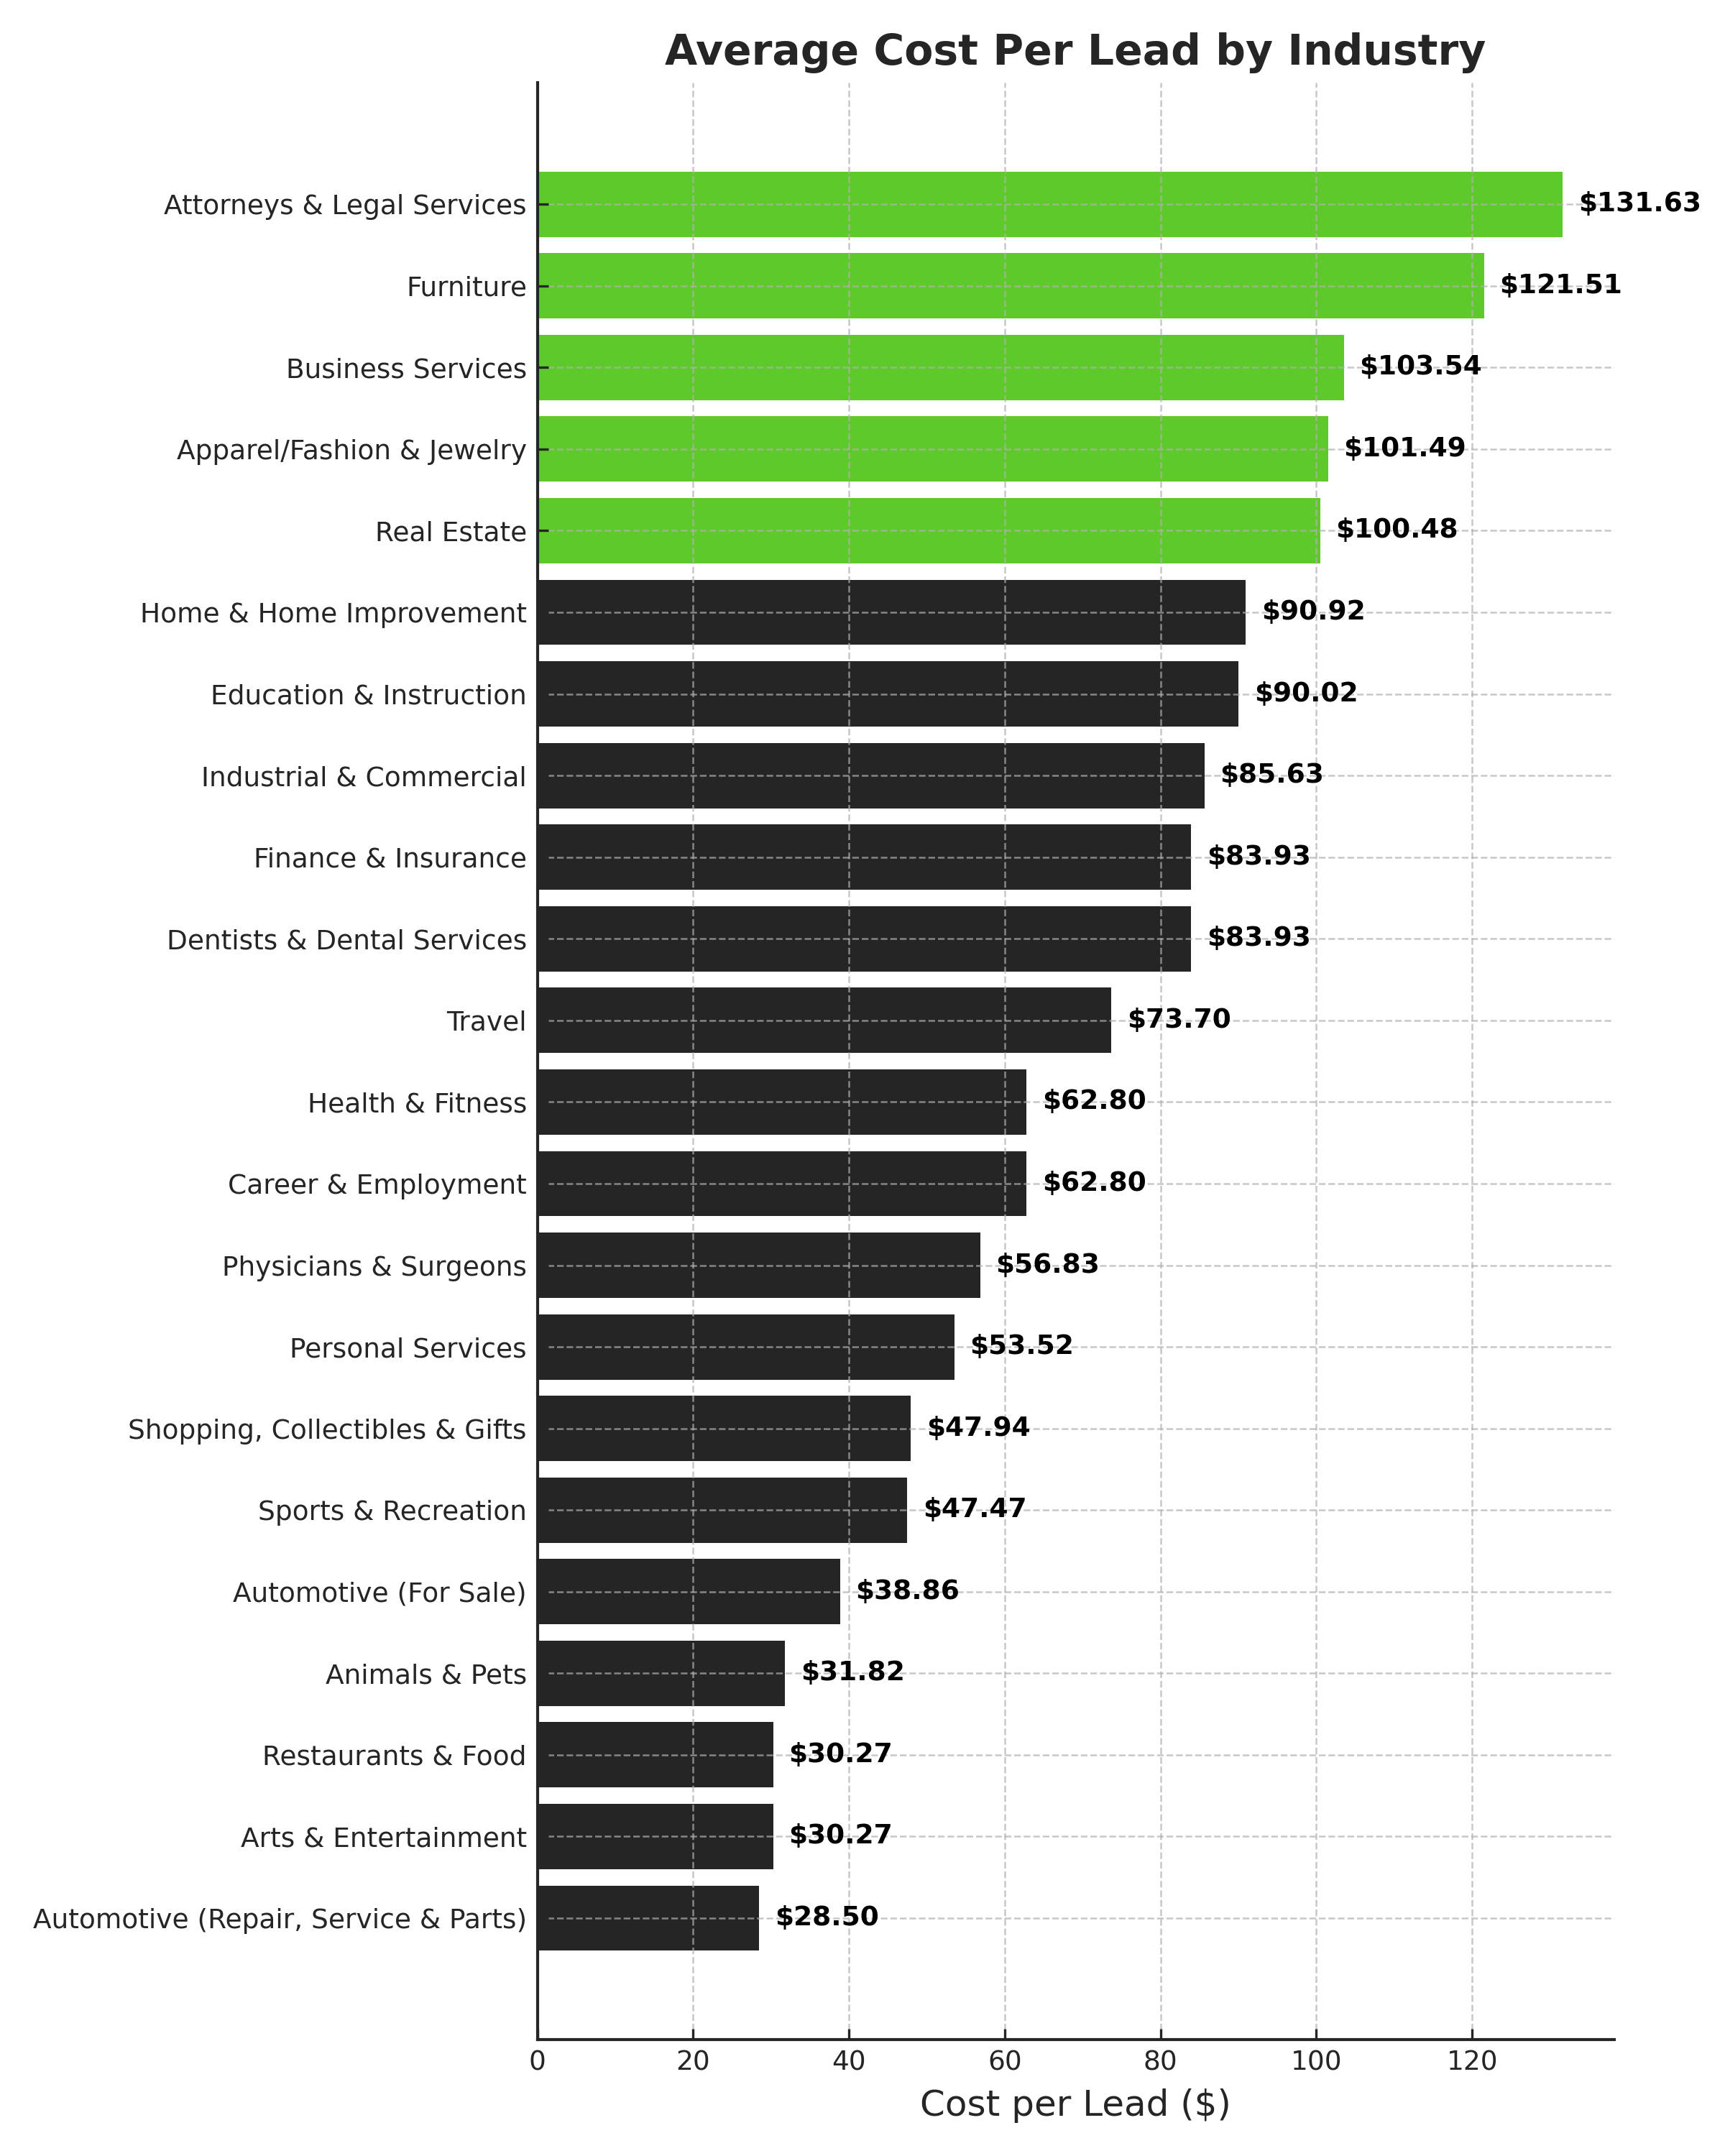
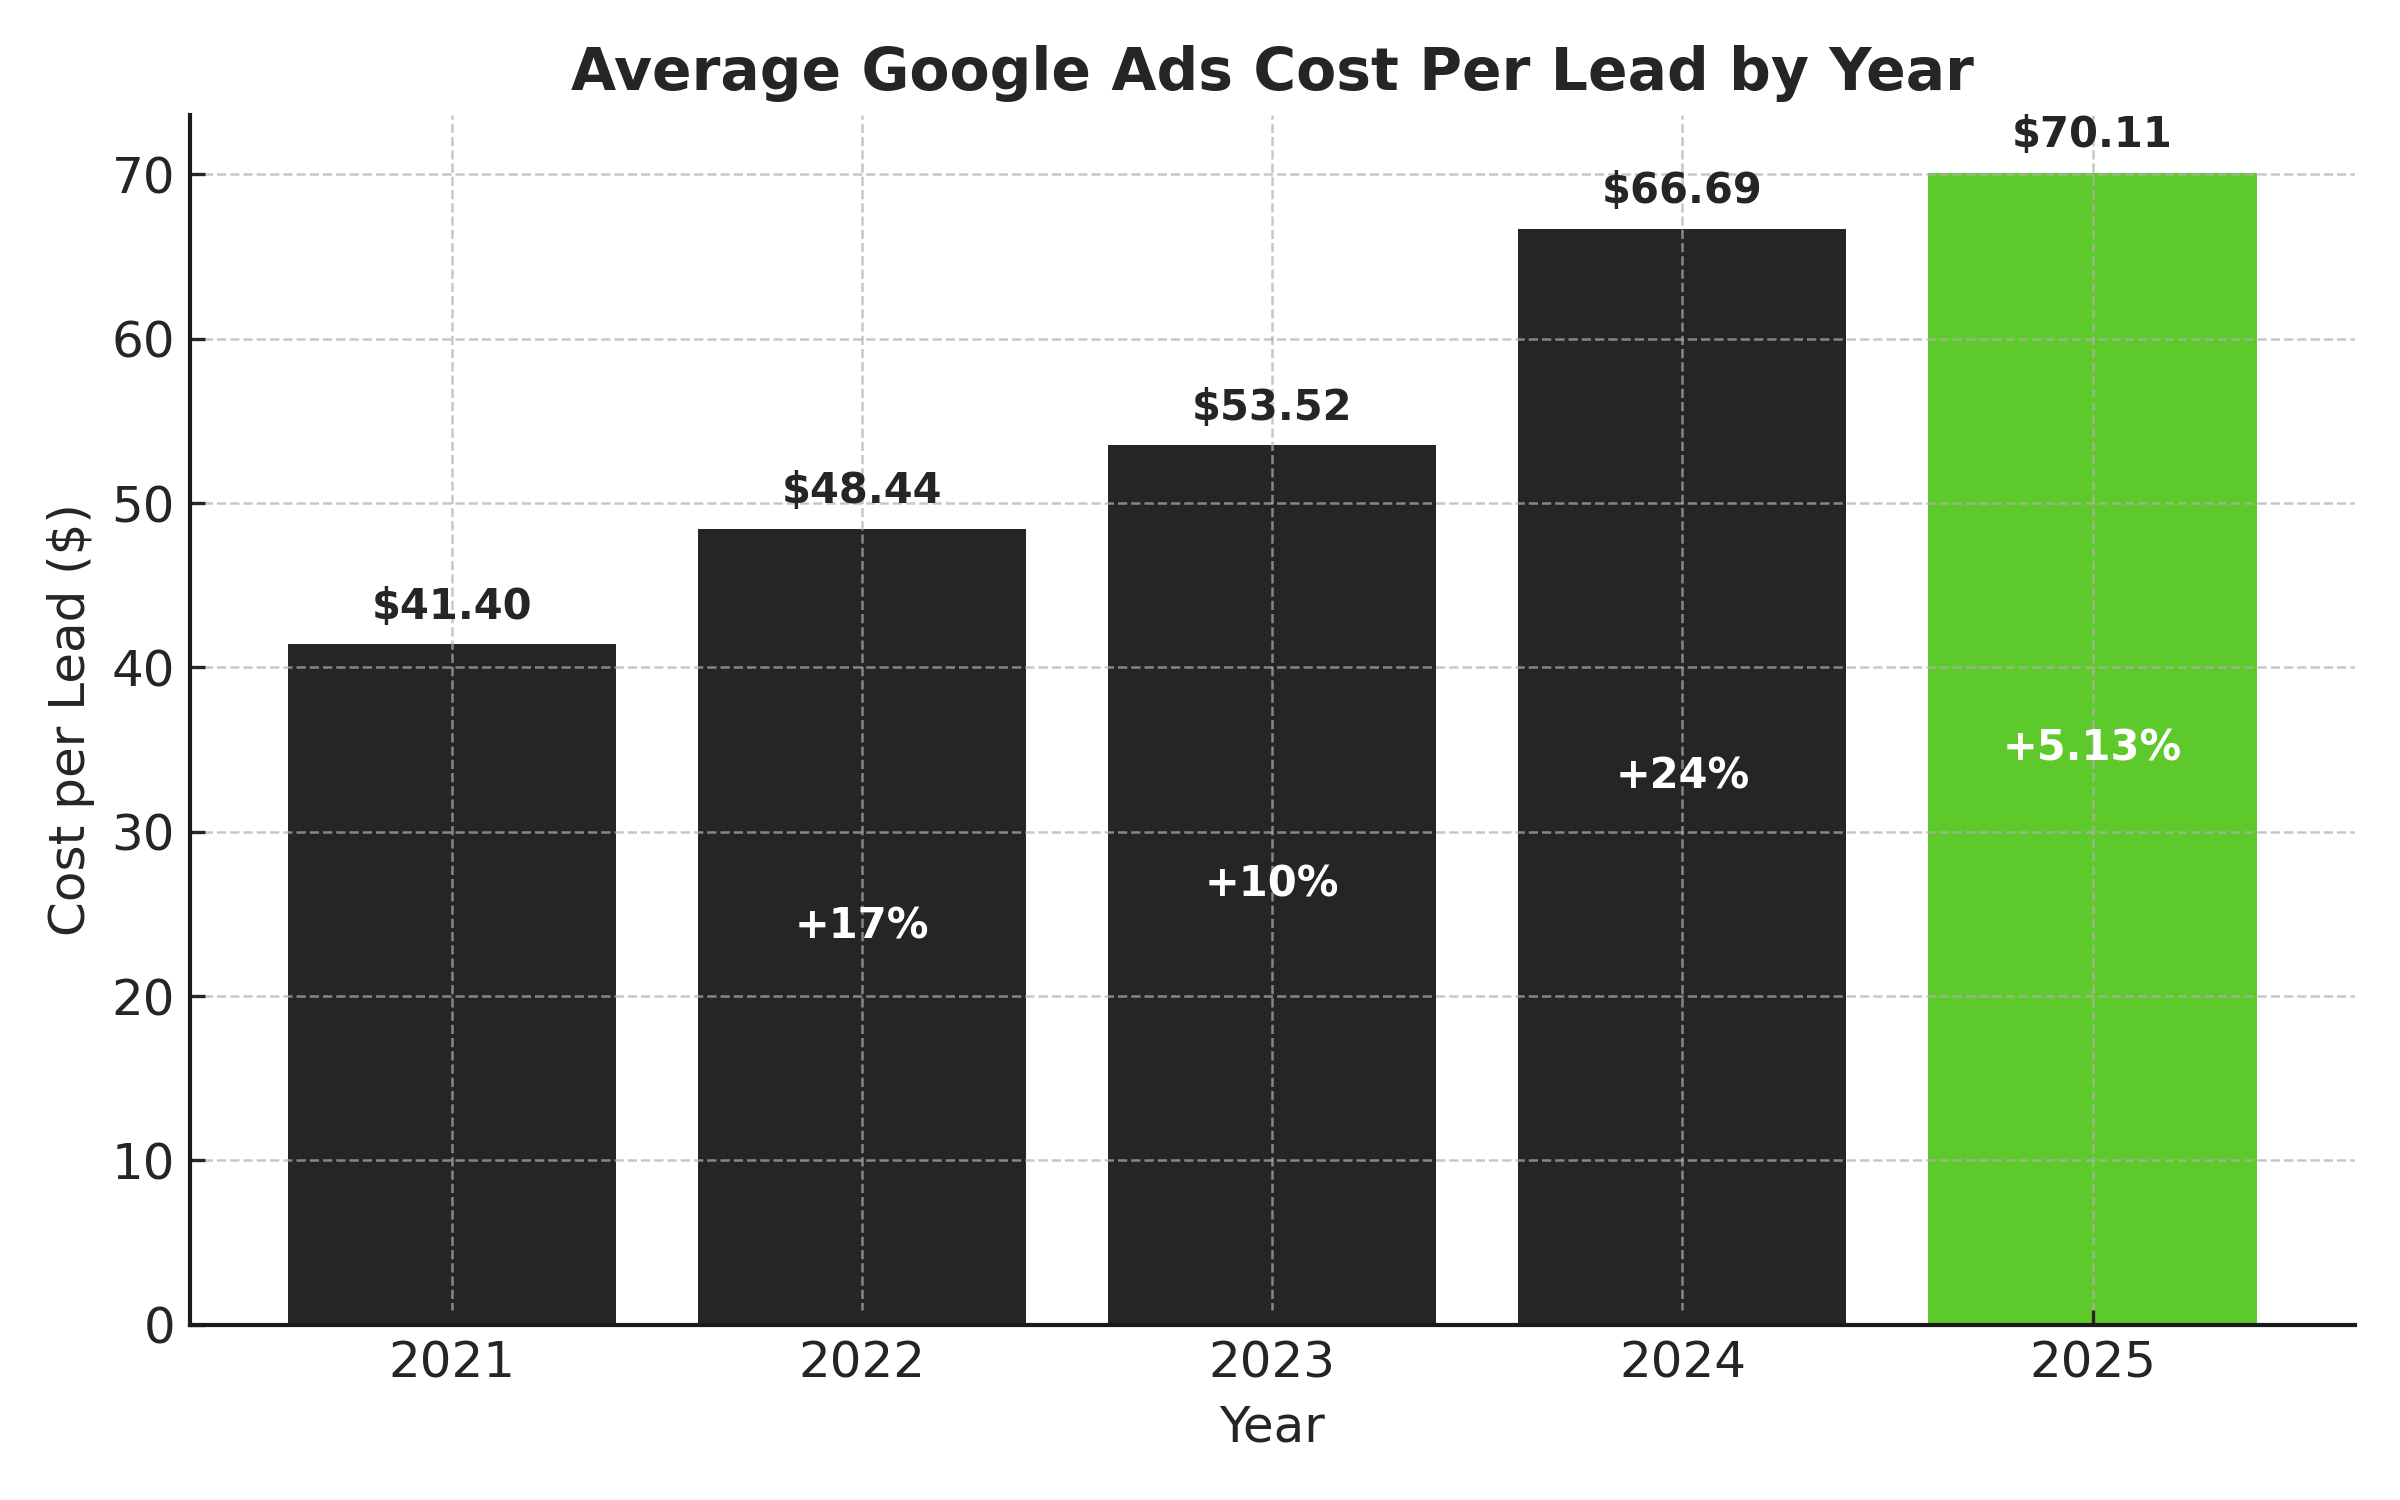
The average cost per lead across industries for Google and Microsoft Ads was **$70.11** last year.
This important KPI is closely scrutinized by marketing and finance teams alike. The **Attorneys and Legal Services** sector had the highest CPL at **$131.63**, a figure often justifiable given the significant returns on investment for businesses in this field.
Conversely, industries with lower-priced goods, such as **Automotive Repair**, reported lower CPLs around **$28.50**, indicating varying benchmark expectations.
Unsurprisingly, **13 out of 23 industries** reported an increase in CPL compared to previous years, reflecting economic changes.
Data from LocaliQ benchmark report, June 2025
Conclusion
Benchmark reports serve to provide guidance, not definitive measurements of your success. If your performance indicators don’t align perfectly with the averages, it doesn’t automatically mean you’re underperforming.
To enhance your performance in the latter half of the year, consider these strategies:
- Align your goals with your industry’s buying journey.
- Diversify your ad spend by exploring platforms like Microsoft Ads.
- Focus on improving ad relevance and landing page experiences.
- Enhance tracking for offline conversions.
- Regularly test and optimize your keyword and bidding strategies.
- Don’t overlook the mobile user experience.
For a comprehensive view, explore Wordstream by LocaliQ’s full report on benchmarks and expert tips to boost your campaigns.
Additional Resources:
Featured Image: Roman Samborskyi/Shutterstock
