Introduction
Welcome to the realm of Google Shopping, a transformative platform that revolutionizes how consumers discover products online. A creation of Craig Nevill-Manning, Google Shopping, originally named Froogle in 2002, has evolved through various transformations. Its latest branding became official on May 31, 2012, cementing its place as a pivotal tool in e-commerce. This platform not only enhances user experience but also serves as an incredible marketing channel for businesses seeking visibility during purchasing decisions.
No more aimless browsing! Google Shopping brings buyers and sellers together, providing users with a streamlined way to find the **best deals** across a multitude of retailers. If you are eager to explore fascinating statistics and insights that can shape your marketing strategy, you’ve landed on the right page. Let’s dive deep into the numbers!
Editor’s Choice
- Google Shopping records approximately 1.2 billion searches per month, as noted by Media Captain.
- Shopping ads can drive conversions at a 30% higher rate compared to traditional text ads.
- An average click-through rate for Google Shopping Ads is around 0.86%, with a conversion rate of 1.9%.
- The average cost per click for Google Shopping is roughly USD 0.66, while e-commerce stores see around USD 1.16.
- According to Seo.ai, about 76% of retail search ad spending is aimed at Google Shopping.
- A striking 85% of clicks on retail ads derive from Shopping ads.
- In 2025, an estimated 36% of online shoppers initiate their product searches through Google.
- E-commerce businesses allocate approximately 80% of their ad budget to Google Shopping.
- On average, businesses invest around USD 770.41 in Google Shopping Ads, though this varies by industry.
- Remarkably, approximately 95% of clicks on mobile devices are directed towards campaigns executed through Google Ads.
Basic Features of Google Shopping
| Topics | Google Shopping |
| Perfect for | Products with high visual appeal |
| User targeting | Based on Google searches |
| Insights | Product-focused |
| Nature of Ads | Visual centric |
| Primary Focus | Driving product sales and increasing visibility |
| Cost Structure | Cost-Per-Click (CPC) |
| Bid Placement | Products |
| KPIs | Impressions, clicks, click-through rate (CTR), conversion rate, and return on ad spend (ROAS) |
| Ad Creation and Management | Dynamically created by Google |
Google Shopping’s Contribution Statistics
- In Q3 2024, Alphabet’s revenue from Google Search and other advertisements reached USD 49.385 billion, reflecting a 12.2% increase from the preceding year (USD 44.026 billion).
- Reports indicate that over 1 million businesses utilize Google Ads to promote their offerings.
- Google states that for every dollar spent on Google Ads, businesses typically see a return of about USD 2.
- Approximately 76% of eCommerce search ad expenditure is dedicated to Shopping ads.
- These Shopping ads account for around 85% of all clicks from Google Shopping and AdWords campaigns.
Google Shopping Growth Statistics

(Source: webappick.com)
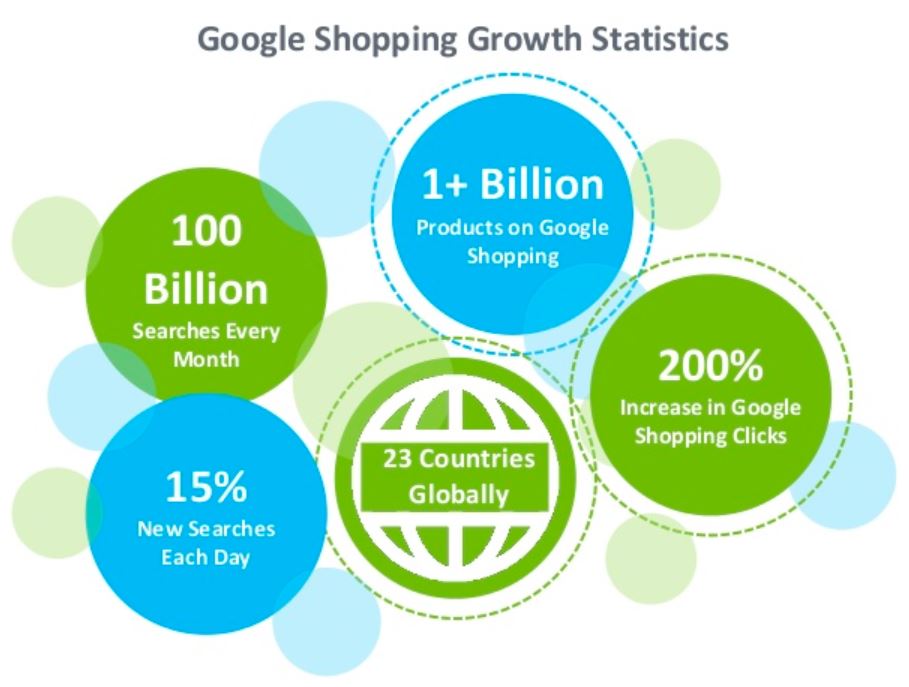
- Over 1 billion products were available on Google Shopping as of 2024.
- A staggering 100 billion searches occur each month, with 15% being new searches daily.
- Shopping clicks within Google Shopping have surged by 200%.
Google Shopping User Statistics
- Reports reveal that approximately 36% of shoppers begin their product search on Google.
- About 19% of users who search for products will click on a Google Shopping result.
- Approximately 65% of clicks on paid Google search results arise from mobile devices.
- According to Klientboost.com, around 70% of smartphone users conduct online searches before making in-store purchases.
Google Shopping Ads Statistics
- The average click-through rate (CTR) for Google Shopping Ads is reported at 0.86%.
- Each click costs approximately USD 0.66, yielding significant profits for many brands.
- The typical conversion rate for these ads is around 1.91%, with businesses spending about USD 38.87 per ad.
- The average budget budget for Google Shopping Ads hovers around USD 770.41.
Average Monthly Budget, Cost Per Click (CPC), And Click-Through Rate (CTR) Of Google Shopping Statistics by Industry
| Industry | Average Monthly Costs (USD) | Average CPC (USD) | Average CTR |
| Medical Supplies | 423.37 | 0.63 | 0.87% |
| Health & Beauty | 1,815.12 | 0.87 | 0.74% |
| Child & Infant Care | 381.46 | 0.36 | 0.71% |
| Pet Care | 384.73 | 0.82 | 0.68% |
| Clothing & Apparel | 801.74 | 0.82 | 0.76% |
| Food & Alcohol | 1,065 | 0.42 | 0.91% |
| Home & Garden | 864.87 | 0.58 | 0.90% |
| HVAC & Climate Control | 1,116.21 | 0.47 | 1.12% |
| Automotive Supplies | 988.34 | 0.56 | 1.20% |
| Travel & Luggage | 273.35 | 0.4 | 0.99% |
| Entertainment & Events | 770.41 | 0.48 | 0.92% |
| Educational Supplies | 296.43 | 0.83 | 0.94% |
| Computers & Technology | 1,473.32 | 0.89 | 0.55% |
| Office & Business Needs | 835.77 | 1.09 | 0.65% |
| Art & Music | 421.02 | 0.34 | 0.76% |
| Chemical & Industrial | 638.66 | 0.66 | 0.89% |
Google Shopping Statistics By User Behaviour
- A staggering 83% of shoppers have reported making repeat purchases due to easy return processes (Grow My Ads report).
- Approximately 72% of voice-activated speaker owners utilize these devices as routine shopping tools.
- About 44% of these users purchase household items through voice commands.
- In the initial phase of shopping, nearly 60% of consumers turn to Google for product searches.
- Approximately 70% of smartphone users explore details online before making in-person purchases.
- Significantly, 59% of shoppers prioritize mobile shopping ease when choosing a store.
Google Shopping Conversion Statistics
- Google shopping ads yield an impressive average conversion rate of 1.91% (Embryo survey analysis).
- Over 90% of online shoppers state that Google reviews influence their brand purchasing decisions.
- Products featuring star ratings on Google Shopping receive a remarkable 24% more clicks compared to those without.
- Ads displaying seller ratings garner 17% more clicks than those lacking such endorsements.
- Shopping ads outperform text ads by 30% in driving conversions.
Google Shopping Brand Awareness Statistics

(Reference: statista.com)
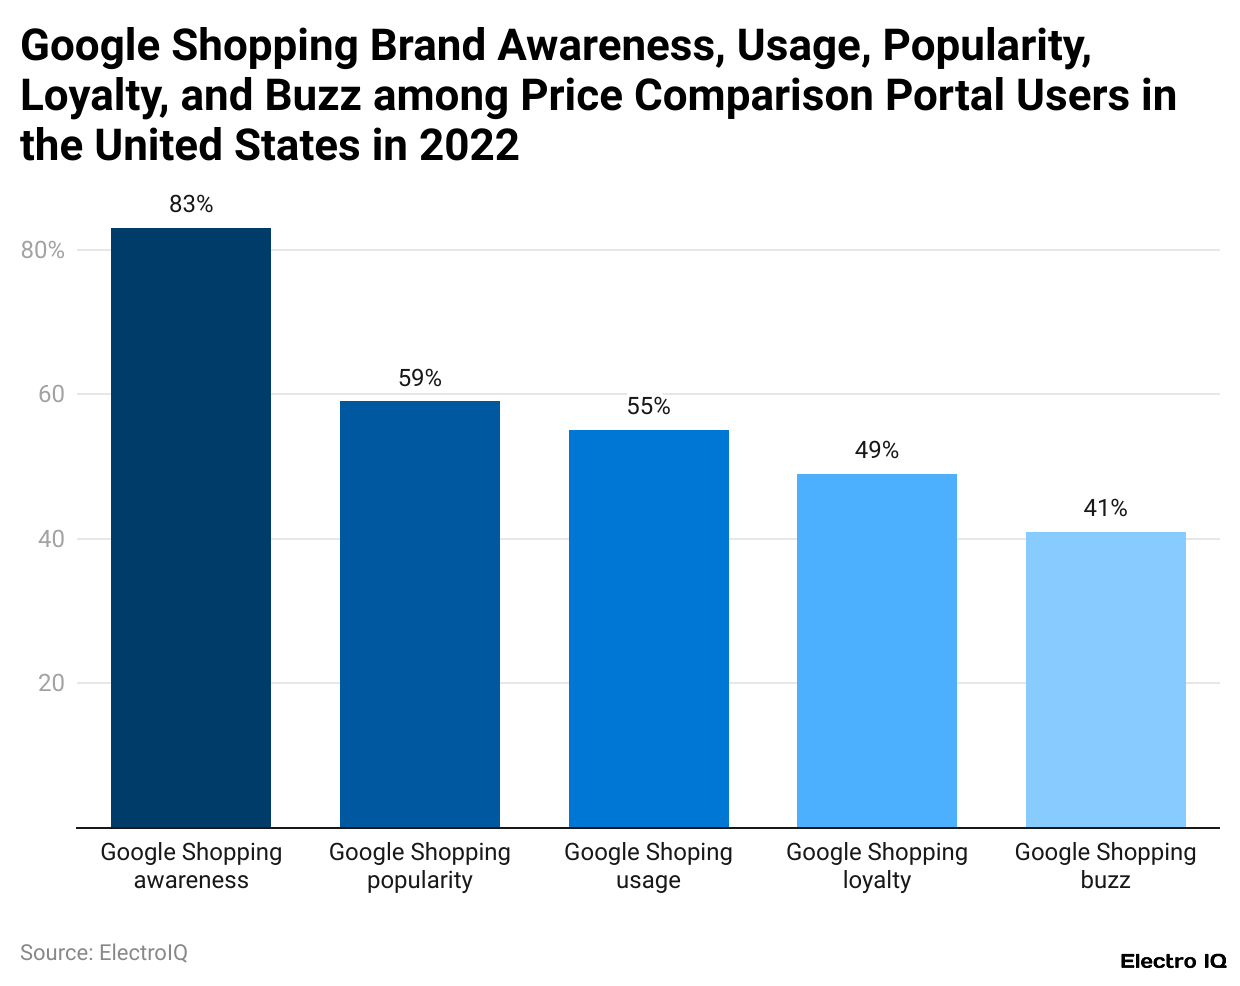
- Recent studies reveal that Google Shopping enjoys 83% brand awareness in the U.S.
- A notable 59% of U.S. price comparison portal users favor Google Shopping.
- In recent years, Google Shopping has commanded a robust 55% share of online shopping traffic.
- About 49% of users express loyalty to the platform.
- Approximately 41% of U.S. shoppers leverage Google Shopping, illustrating its growing prominence.
Website Traffic of Google Analytics Statistics
- As of May 2025, shopping.google.com recorded around 817.9 K visits, according to SimilarWeb.
- This marked a 21.35% decrease in web traffic.
- The website’s bounce rate in the same period was recorded at 3.42%.
- The pages per visit averaged 6.15, with an average visit duration of 1 minute 9 seconds.
- Influencing its ranking, shopping.google.com holds a global rank of #43,854, with more impressive placements in various countries.
By Country
- The United States accounted for 31.13% of the total traffic share in May 2025.
- Germany followed with 13.88%, Brazil at 13.00%, and the U.K. at 8.37%.
- Other countries contributed 27.09%.
By Marketing Channels Distribution
- Organic searches dominated the traffic share, accounting for 46.85%.
- Direct traffic closely followed at 45.9%, with referrals contributing 4.08%.
Conclusion
As we wrap up this exploration into the vast world of Google Shopping, one thing becomes clear: it is **indispensable** for both consumers and businesses navigating the dynamic landscape of e-commerce. With its ability to connect shoppers with products, compare prices seamlessly, and introduce new brands, Google Shopping stands as a cornerstone in modern retail.
This comprehensive article encapsulates valuable statistical insights and facts about Google Shopping, designed to enhance your understanding and inform your strategies in this ever-evolving marketplace.


